Update 20130212: Please consider this a work in progress. I am re-running most of these tests now using the same LUN for every filesystem to exclude storage-side variance. I am also using some additional init parameters to disable Oracle optimizations to focus the read tests more on db file sequential reads and avoid db file parallel reads. My posts so far document the setup I’ve used and I’m already noting flaws in it. Use this and others’ SLOB posts as a guide to run tests on YOUR system with YOUR setup, for best results.
Update 20130228: I have re-run my tests using the same storage LUN for each test. I have updated the charts, text, and init parameters to reflect my latest results. I have also used a 4k BLOCKSIZE for all redo log testing. Further, instead of running each test three times and taking the average, I have run each test ten times, dropped the highest and lowest values, and averaged the remaining eight, in hopes of gaining a more accurate result. Where I have changed my setup compared to the original post, I have left the old text in, struck out like this.
In Part 1 and Part 1.5 I covered the setup and scripts I’ve used to benchmark performance of various filesystems (and raw devices) using SLOB for Oracle datafiles and redo logs. In this post I will provide more details, including the results and database init parameters in use for my tests. This is an SAP shop so I have several event and _fix_control parameters in place that may have performance impacts. SAP says “use them” so I wanted my tests to reflect the performance I could hope to see through the SAP applications,
I do not intend these tests to demonstrate the maximum theoretical I/O that our hardware can push using each filesystem. I intend them to demonstrate what performance I can expect if I were to change the databases to use each listed filesystem while making minimal (preferably zero) other changes to our environment. I know, for example, that adding more network paths or faster ethernet or splitting the bonded paths will improve Oracle direct NFS performance, but I am testing with what we have available at the moment, not what we COULD have.
Now that 11g is certified on Oracle Linux 6, we are building out an OL6.3 box and I will be running identical tests on that server in a couple weeks. I’m expecting to see some significant improvement in BTRFS performance there.
With that said, some information on the test environment:
- Server OS: SLES 11SP2 (kernel 3.0.51-0.7.9-default)
- Oracle version: 11.2.0.3.2 (CPUApr2012 + SAP Bundle Patch May2012)
- 2 CPU sockets, 8 cores per socket, with hyper-threading (Oracle sees CPU_COUNT = 32 but I have set CPU_COUNT to 2 to allow me to create a very small buffer cache)
- All filesystems and raw devices created within a single volume in a single NetApp storage aggregate
- I use only single instance databases so no effort was made to test cluster filesystems or RAC performance
Some notes about each test:
- All tests run in NOARCHIVELOG mode — obviously you should not do this in production
- Each filesystem was tested by creating SLOB users in a single tablespace containing a single
16GB4GB datafile on the indicated filesystem - All redo logs created with 4k blocksize
- All datafiles created with default parameters, I did not specify anything other than size and filename
- Read-only tests run with a
64M32M db_cache_size to force PIO - Redo generation tests run with a large log_buffer and two 32GB redo logs on the listed filesystem, with a 32G db_cache_size. I also set log_checkpoint_timeout to 999999999 to avert time-based checkpoints.
XFS redo testing performed with filesystemio_options=none, as otherwise I could not create redo logs on XFS without using an underscore parameter and specifying the sector size when creating the logs (see http://flashdba.com/4k-sector-size/ for more information on this issue). All other tests used filesystemio_options=setall; only XFS redo required none.All tests run with filesystemio_options=setall.- Read-write tests run with three 64MB redo logs stored on raw devices and 128M db_cache_size
- Every test was run
threeten times with 8 sessions,threeten times with 16 sessions, andthreeten times with 32 sessions, and an overall average was taken after dropping high and low values.Prior to each batch of tests the database was bounced.Per Kevin Closson’s recommendation, I executed a throwaway SLOB run after each bounce, discarding the results. “NFS” refers to Oracle direct NFSI dropped the NFS tests, as our ethernet setup is currently only 1Gb and does not perform as well as FC- Automated tasks like the gather stats job, segment and tuning advisors were disabled
- The BTRFS volume was mounted with nodatacow to avoid copy-on-write
Results
Oracle’s standard license prohibits publication of customer publication of benchmark results without express written consent. To avoid any confusion that these results represent a benchmark, I am NOT publishing any of the absolute numbers. Instead I have scaled all results such that the performance of a RAW device is equal to 1, and all other results are reported relative to RAW. I make no claims that these results represent the best possible performance available from my software/hardware configuration. What they should accurately reflect, though, is what someone with a similar setup could expect to see if they were to create redo logs or datafiles on the indicated filesystem without performing any tuning to optimize the database, OS or filesystem.
Comments
I am disappointed with the performance of BTRFS. Our OS vendor is deprecating ext4 in favor of BTRFS so if we’re going to abandon ext3 due to fsck issues BTRFS is the path of least resistance. Ext4 appears to provide performance similar to ext3 and should reduce fsck runtimes so if we stay on cooked devices that looks like the way to go. Raw performance won overall (though storage write caching appears to have made ext3 look better than raw) but it has management issues such as the 255-device limit and inability to extend a datafile on a raw device. ASM should provide the same overall performance as raw without the limitations, but adds additional management overhead with the need to install Grid Infrastructure and that just gives one more target to keep up to date on patches. XFS had poor performance for redo logs in my environment but good performance elsewhere, and it should entirely avoid fsck-on-boot problems.
Direct NFS seemed to deliver the most consistent performance from test to test, with a smaller standard deviation than any of the others. This might be relevant for anyone who requires consistent performance more than maximal performance.
Read Performance

Scaled read performance
Redo Generation Performance
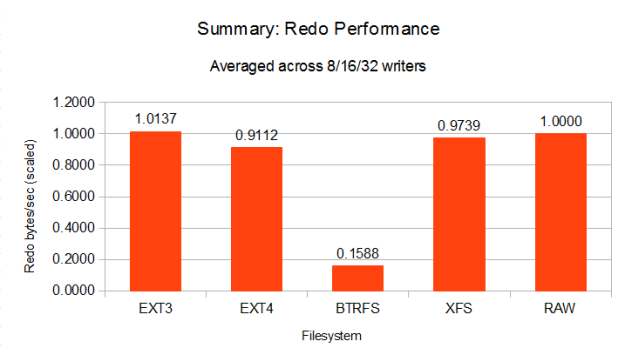
Scaled redo generation performance
Read/Write Performance

Scaled read/write performance
Init Parameters
Below are the init parameters used for each test. Note that filesystemio_options had to be set to none for the XFS redo generation testing, but other than that these parameters are accurate for all the tests.
Read Performance
SLOB.__db_cache_size=34359738368
SLOB.__oracle_base='/oracle/SLOB'#ORACLE_BASE set from environment
SLOB.__shared_pool_size=704643072
*._db_block_prefetch_limit=0
*._db_block_prefetch_quota=0
*._db_file_noncontig_mblock_read_count=0
*._disk_sector_size_override=TRUE
*._fix_control='5099019:ON','5705630:ON','6055658:OFF','6399597:ON','6430500:ON','6440977:ON','6626018:ON','6972291:ON','8937971:ON','9196440:ON','9495669:ON','13077335:ON'#SAP_112031_201202 RECOMMENDED SETTINGS
*._mutex_wait_scheme=1#RECOMMENDED BY ORACLE/SAP FOR 11.2.0 - SAP note 1431798
*._mutex_wait_time=10#RECOMMENDED BY ORACLE/SAP FOR 11.2.0 - SAP note 1431798
*._optim_peek_user_binds=FALSE#RECOMMENDED BY ORACLE/SAP FOR 11.2.0 - SAP note 1431798
*._optimizer_adaptive_cursor_sharing=FALSE#RECOMMENDED BY ORACLE/SAP FOR 11.2.0 - SAP note 1431798
*._optimizer_extended_cursor_sharing_rel='NONE'#RECOMMENDED BY ORACLE/SAP FOR 11.2.0 - SAP note 1431798
*._optimizer_use_feedback=FALSE#RECOMMENDED BY ORACLE/SAP FOR 11.2.0 - SAP note 1431798
*.audit_file_dest='/oracle/SLOB/saptrace/audit'
*.compatible='11.2.0.2'
*.control_file_record_keep_time=30
*.control_files='/oracle/SLOB/cntrl/cntrlSLOB.dbf','/oracle/SLOB/cntrlm/cntrlSLOB.dbf'
*.cpu_count=1
*.db_block_size=8192
*.db_cache_size=33554432
*.db_files=500
*.db_name='SLOB'
*.db_recovery_file_dest_size=8589934592
*.db_recovery_file_dest='/oracle/SLOB/fra'
*.db_writer_processes=2
*.diagnostic_dest='/oracle/SLOB/saptrace'
*.event='10027','10028','10142','10183','10191','10995 level 2','38068 level 100','38085','38087','44951 level 1024'#SAP_112030_201112 RECOMMENDED SETTINGS
*.filesystemio_options='SETALL'
*.local_listener='LISTENER_SLOB'
*.log_archive_dest_1='LOCATION=/oracle/SLOB/arch/SLOBarch'
*.log_archive_format='%t_%s_%r.dbf'
*.log_buffer=14221312
*.log_checkpoints_to_alert=TRUE
*.max_dump_file_size='20000'
*.open_cursors=1600
*.optimizer_dynamic_sampling=6
*.parallel_execution_message_size=16384
*.parallel_max_servers=0
*.parallel_threads_per_cpu=1
*.pga_aggregate_target=10737418240
*.processes=800
*.query_rewrite_enabled='FALSE'
*.recyclebin='off'
*.remote_login_passwordfile='EXCLUSIVE'
*.remote_os_authent=TRUE#SAP note 1431798
*.replication_dependency_tracking=FALSE
*.resource_manager_plan=''
*.sessions=800
*.sga_max_size=10737418240
*.shared_pool_size=5242880000
*.star_transformation_enabled='TRUE'
*.undo_retention=432000
*.undo_tablespace='PSAPUNDO'
Redo Generation Performance
SLOB.__db_cache_size=34359738368
SLOB.__oracle_base='/oracle/SLOB'#ORACLE_BASE set from environment
SLOB.__shared_pool_size=704643072
*._db_block_prefetch_limit=0
*._db_block_prefetch_quota=0
*._db_file_noncontig_mblock_read_count=0
*._disk_sector_size_override=TRUE
*._fix_control='5099019:ON','5705630:ON','6055658:OFF','6399597:ON','6430500:ON','6440977:ON','6626018:ON','6972291:ON','8937971:ON','9196440:ON','9495669:ON','13077335:ON'#SAP_112031_201202 RECOMMENDED SETTINGS
*._mutex_wait_scheme=1#RECOMMENDED BY ORACLE/SAP FOR 11.2.0 - SAP note 1431798
*._mutex_wait_time=10#RECOMMENDED BY ORACLE/SAP FOR 11.2.0 - SAP note 1431798
*._optim_peek_user_binds=FALSE#RECOMMENDED BY ORACLE/SAP FOR 11.2.0 - SAP note 1431798
*._optimizer_adaptive_cursor_sharing=FALSE#RECOMMENDED BY ORACLE/SAP FOR 11.2.0 - SAP note 1431798
*._optimizer_extended_cursor_sharing_rel='NONE'#RECOMMENDED BY ORACLE/SAP FOR 11.2.0 - SAP note 1431798
*._optimizer_use_feedback=FALSE#RECOMMENDED BY ORACLE/SAP FOR 11.2.0 - SAP note 1431798
*.audit_file_dest='/oracle/SLOB/saptrace/audit'
*.compatible='11.2.0.2'
*.control_file_record_keep_time=30
*.control_files='/oracle/SLOB/cntrl/cntrlSLOB.dbf','/oracle/SLOB/cntrlm/cntrlSLOB.dbf'
*.cpu_count=1
*.db_block_size=8192
*.db_cache_size=34359738368
*.db_files=500
*.db_name='SLOB'
*.db_recovery_file_dest_size=8589934592
*.db_recovery_file_dest='/oracle/SLOB/fra'
*.db_writer_processes=2
*.diagnostic_dest='/oracle/SLOB/saptrace'
*.event='10027','10028','10142','10183','10191','10995 level 2','38068 level 100','38085','38087','44951 level 1024'#SAP_112030_201112 RECOMMENDED SETTINGS
*.filesystemio_options='SETALL'
*.local_listener='LISTENER_SLOB'
*.log_archive_dest_1='LOCATION=/oracle/SLOB/arch/SLOBarch'
*.log_archive_format='%t_%s_%r.dbf'
*.log_buffer=268427264
*.log_checkpoint_timeout=99999999
*.log_checkpoints_to_alert=TRUE
*.max_dump_file_size='20000'
*.open_cursors=1600
*.optimizer_dynamic_sampling=6
*.parallel_execution_message_size=16384
*.parallel_max_servers=0
*.parallel_threads_per_cpu=1
*.pga_aggregate_target=10737418240
*.processes=800
*.query_rewrite_enabled='FALSE'
*.recyclebin='off'
*.remote_login_passwordfile='EXCLUSIVE'
*.remote_os_authent=TRUE#SAP note 1431798
*.replication_dependency_tracking=FALSE
*.resource_manager_plan=''
*.sessions=800
*.sga_max_size=68719476736
*.shared_pool_size=5242880000
*.star_transformation_enabled='TRUE'
*.undo_retention=432000
*.undo_tablespace='PSAPUNDO'
Read/Write Performance
SLOB.__db_cache_size=34359738368
SLOB.__oracle_base='/oracle/SLOB'#ORACLE_BASE set from environment
SLOB.__shared_pool_size=704643072
*._db_block_prefetch_limit=0
*._db_block_prefetch_quota=0
*._db_file_noncontig_mblock_read_count=0
*._disk_sector_size_override=TRUE
*._fix_control='5099019:ON','5705630:ON','6055658:OFF','6399597:ON','6430500:ON','6440977:ON','6626018:ON','6972291:ON','8937971:ON','9196440:ON','9495669:ON','13077335:ON'#SAP_112031_201202 RECOMMENDED SETTINGS
*._mutex_wait_scheme=1#RECOMMENDED BY ORACLE/SAP FOR 11.2.0 - SAP note 1431798
*._mutex_wait_time=10#RECOMMENDED BY ORACLE/SAP FOR 11.2.0 - SAP note 1431798
*._optim_peek_user_binds=FALSE#RECOMMENDED BY ORACLE/SAP FOR 11.2.0 - SAP note 1431798
*._optimizer_adaptive_cursor_sharing=FALSE#RECOMMENDED BY ORACLE/SAP FOR 11.2.0 - SAP note 1431798
*._optimizer_extended_cursor_sharing_rel='NONE'#RECOMMENDED BY ORACLE/SAP FOR 11.2.0 - SAP note 1431798
*._optimizer_use_feedback=FALSE#RECOMMENDED BY ORACLE/SAP FOR 11.2.0 - SAP note 1431798
*.audit_file_dest='/oracle/SLOB/saptrace/audit'
*.compatible='11.2.0.2'
*.control_file_record_keep_time=30
*.control_files='/oracle/SLOB/cntrl/cntrlSLOB.dbf','/oracle/SLOB/cntrlm/cntrlSLOB.dbf'
*.cpu_count=1
*.db_block_size=8192
*.db_cache_size=134217728
*.db_files=500
*.db_name='SLOB'
*.db_recovery_file_dest_size=8589934592
*.db_recovery_file_dest='/oracle/SLOB/fra'
*.db_writer_processes=2
*.diagnostic_dest='/oracle/SLOB/saptrace'
*.event='10027','10028','10142','10183','10191','10995 level 2','38068 level 100','38085','38087','44951 level 1024'#SAP_112030_201112 RECOMMENDED SETTINGS
*.filesystemio_options='SETALL'
*.local_listener='LISTENER_SLOB'
*.log_archive_dest_1='LOCATION=/oracle/SLOB/arch/SLOBarch'
*.log_archive_format='%t_%s_%r.dbf'
*.log_buffer=268427264
*.log_checkpoint_timeout=99999999
*.log_checkpoints_to_alert=TRUE
*.max_dump_file_size='20000'
*.open_cursors=1600
*.optimizer_dynamic_sampling=6
*.parallel_execution_message_size=16384
*.parallel_max_servers=0
*.parallel_threads_per_cpu=1
*.pga_aggregate_target=10737418240
*.processes=800
*.query_rewrite_enabled='FALSE'
*.recyclebin='off'
*.remote_login_passwordfile='EXCLUSIVE'
*.remote_os_authent=TRUE#SAP note 1431798
*.replication_dependency_tracking=FALSE
*.resource_manager_plan=''
*.sessions=800
*.sga_max_size=34359738368
*.shared_pool_size=5242880000
*.star_transformation_enabled='TRUE'
*.undo_retention=432000
*.undo_tablespace='PSAPUNDO'
Supplementary Data
I have removed the content of this section on 20130228 as it related to my previous results and not the updated results now contained in this posting.
Filed under: Database

